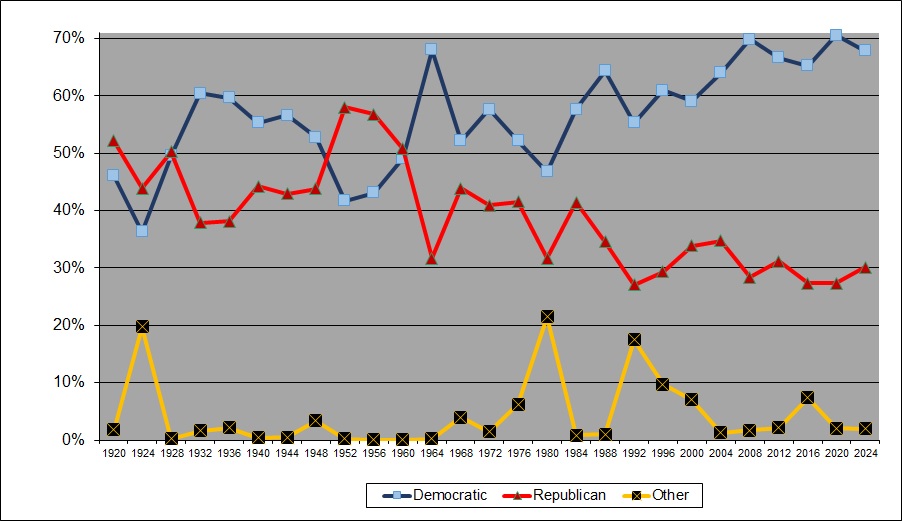
| Year |
Democratic |
Republican | Other (combined) |
| 1920 | 46.07% | 52.15% | 1.79% |
| 1924 | 36.35% | 43.91% | 19.74% |
| 1928 | 49.53% | 50.27% | 0.20% |
| 1932 | 60.51% | 37.87% | 1.62% |
| 1936 | 59.65% | 38.18% | 2.17% |
| 1940 | 55.35% | 44.23% | 0.42% |
| 1944 | 56.62% | 42.93% | 0.45% |
| 1948 | 52.82% | 43.79% | 3.39% |
| 1952 | 41.69% | 58.04% | 0.26% |
| 1956 | 43.10% | 56.84% | 0.06% |
| 1960 | 49.11% | 50.80% | 0.09% |
| 1964 | 68.08% | 31.73% | 0.19% |
| 1968 | 52.19% | 43.88% | 3.93% |
| 1972 | 57.66% | 40.92% | 1.42% |
| 1976 | 52.21% | 41.57% | 6.22% |
| 1980 | 46.80% | 31.73% | 21.47% |
| 1984 | 57.72% | 41.46% | 0.82% |
| 1988 | 64.41% | 34.61% | 0.98% |
| 1992 | 55.35% | 27.12% | 17.53% |
| 1996 | 60.98% | 29.31% | 9.71% |
| 2000 | 59.08% | 33.92% | 7.00% |
| 2004 | 64.04% | 34.72% | 1.24% |
| 2008 | 69.91% | 28.40% |
1.67% |
| 2012 | 66.69% | 31.19% |
2.12% |
| 2016 | 65.25% | 27.35% |
7.40% |
| 2020 | 70.57% | 27.34% |
2.09% |
| 2024 | 67.92% | 30.11% |
1.97% |
Our records prior to 1972 do not indicate presidential write-ins.
1920
| Warren G. Harding (Rep) | 5,696 | 52.15% |
| James Cox (Dem) | 5,032 | 46.07% |
| Eugene Debs (Socialist) | 136 | 1.25% |
| Parley Christiansen (Farmer-Labor) | 27 | 0.25% |
| Aaron Watkins (Prohibition) | 19 | 0.17% |
| William Cox (Socialist Labor) | 13 | 0.12% |
1924
| Calvin Coolidge (Rep) | 5,741 | 43.91% |
| John Davis (Dem) | 4,752 | 36.35% |
| Robert LaFollette (Progressive) | 2,553 | 19.53% |
| William Foster (Communist) | 17 | 0.13% |
| Frank Johns (Socialist Labor) | 10 | 0.08% |
1928
| Herbert Hoover (Rep) | 7,288 | 50.27% |
| Al Smith (Dem) | 7,181 | 49.53% |
| Norman Thomas (Socialist) | 15 | 0.10% |
| Frank Webb (Farmer-Labor) | 12 | 0.08% |
| Verne Reynolds (Socialist Labor) | 2 | 0.01% |
| William Foster (Communist) | 0 | 0.00% |
Note: Foster appeared on the Iowa ballot and received 328 votes statewide, but our records indicate zero votes in Johnson County.
1932
| Franklin D. Roosevelt (Dem) | 8,764 | 60.51% |
| Herbert Hoover (Rep) | 5,484 | 37.87% |
| Norman Thomas (Socialist) | 194 | 1.34% |
| William Upshaw (Prohibition) | 20 | 0.14% |
| Jacob Coxey (Farmer-Labor) | 19 | 0.13% |
| William Foster (Communist) | 2 | 0.01% |
1936
| Franklin D. Roosevelt (Dem) | 8,794 | 59.65% |
| Alfred M. Landon (Rep) | 5,629 | 38.18% |
| William Lemke (Union) | 262 | 1.78% |
| Norman Thomas (Socialist) | 27 | 0.18% |
| D. Leigh Colvin (Prohibition) | 25 | 0.17% |
| Earl Browder (Communist) | 5 | 0.03% |
| John Aiken (Socialist Labor) | 1 | 0.01% |
1940
| Franklin D. Roosevelt (Dem) | 9,017 | 55.35% |
| Wendell Willkie (Rep) | 7,206 | 44.23% |
| Earl Browder (Communist) | 30 | 0.18% |
| Roger Babson (Prohibition) | 16 | 0.10% |
| Norman Thomas (Socialist) | 13 | 0.08% |
| John Aiken (Socialist Labor) | 9 | 0.06% |
1944
| Franklin D. Roosevelt (Dem) | 8,434 | 56.62% |
| Thomas E. Dewey (Rep) | 6,396 | 42.93% |
| Claude Watson (Prohibition) | 35 | 0.23% |
| Norman Thomas (Socialist) | 33 | 0.21% |
| Edward Teichert (Socialist Labor) | 1 | 0.01% |
1948
| Harry S Truman (Dem) | 8,611 | 52.82% |
| Thomas E. Dewey (Rep) | 7.139 | 43.79% |
| Henry A. Wallace (Progressive) | 359 | 2.20% |
| Norman Thomas (Socialist) | 123 | 0.75% |
| Edward Teichert (Socialist Labor) | 36 | 0.22% |
| Claude Watson (Prohibition) | 33 | 0.20% |
| Farrell Dobbs (Socialist Workers) | 2 | 0.01% |
Note: Strom Thurmond (State's Rights Democratic Party or "Dixiecrat") won 39 electoral votes and four states, but did not appear on the Iowa ballot.
1952
| Dwight D. Eisenhower (Rep) | 11,231 | 58.04% |
| Adlai E. Stevenson (Dem) | 8,067 | 41.69% |
| Vincent Hallinan (Progressive) | 29 | 0.15% |
| Stuart Hamblen (Prohibition) | 17 | 0.09% |
| Darlington Hoopes (Socialist) | 3 | 0.02% |
| Eric Hass (Socialist Labor) | 2 | 0.01% |
1956
| Dwight D. Eisenhower (Rep) | 11,298 | 56.84% |
| Adlai E. Stevenson (Dem) | 8,567 | 43.10% |
| T. Coleman Andrews (American Constitution) | 11 | 0.06% |
1960
| Richard Nixon (Rep) | 10,927 | 50.80% |
| John F. Kennedy (Dem) | 10,563 | 49.11% |
| Farrell Dobbs (Farmer-Labor) | 15 | 0.07% |
| Eric Hass (Soc. Labor) | 3 | 0.01% |
1964
| Lyndon Johnson (Dem) | 14,717 | 68.08% |
| Barry Goldwater (Rep) | 6,860 | 31.73% |
| E. Harold Munn Sr. (Prohibition) | 27 | 0.12% |
| Eric Hass (Soc. Labor) | 9 | 0.04% |
| Clifton DeBerry (Soc. Workers) | 5 | 0.02% |
1968
| Hubert Humphrey (Dem) | 13,541 | 52.19% |
| Richard Nixon (Rep) | 11,384 | 43.88% |
| George Wallace (American Independent) | 736 | 2.84% |
| Eldridge Cleaver (Peace & Freedom) | 180 | 0.69% |
| Fred Halstead (Soc. Work.) | 63 | 0.24% |
| Henning Blomen (Soc. Labor) | 29 | 0.11% |
| Kirby Hensley (Universal) | 7 | 0.03% |
| Earle Munn (Prohibition) | 4 | 0.02% |
| George McGovern (Dem) | 20,922 | 57.76% |
| Richard Nixon (Rep) | 14,823 | 40.92% |
| John Schmitz (American) | 360 | 0.99% |
| Gus Hall (Communist) | 50 | 0.14% |
| Linda Jenness (Soc. Work.) | 29 | 0.08% |
| Gabriel Green (Universal) | 12 | 0.03% |
| Louis Fisher (Soc. Labor) | 11 | 0.03% |
| scattered write in | 15 | 0.04% |
| Jimmy Carter (Dem) | 20,208 | 52.21% |
| Gerald Ford (Rep) | 16,090 | 41.57% |
| Eugene McCarthy (Nom. Pet.) | 2,082 | 5.38% |
| Roger MacBride (Libertarian) | 99 | 0.26% |
| Gus Hall (Communist) | 90 | 0.23% |
| Thomas J. Anderson (American) | 43 | 0.11% |
| Peter Camejo (Soc. Work.) | 36 | 0.09% |
| Frank Zeidler (Socialist) | 26 | 0.07% |
| Lyndon LaRouche (US Labor) | 12 | 0.03% |
| Julius Levin (Soc. Labor) | 6 | 0.02% |
| Scattered write in | 13 |
| Jimmy Carter (Dem) | 20,122 | 46.80% |
| Ronald Reagan (Rep) | 13,642 | 31.73% |
| John Anderson (Nom. Pet.) | 8,101 | 18.84% |
| Ed Clark (Libertarian) | 508 | 1.18% |
| Barry Commoner (Citizens) | 403 | 0.94% |
| David McReynolds (Socialist) | 111 | 0.26% |
| Gus Hall (Communist) | 61 | 0.14% |
| Clifton DeBerry (Soc. Work.) | 21 | 0.05% |
| Percy Greaves (American) | 10 | 0.02% |
| Benjamin Bubar (Prohibition) | 5 | 0.01% |
| Scattered write in | 13 |
|
| Walter Mondale (Dem) | 26,000 | 57.72% |
| Ronald Reagan (Rep) | 18,677 | 41.46% |
| David Bergland (Libertarian) | 127 | 0.28% |
| Lyndon LaRouche (Nom. Pet.) | 54 | 0.12% |
| Mel Mason (Soc Workers) | 24 | 0.05% |
| Gus Hall (Communist) | 23 | 0.05% |
| Gerald Baker (Big Deal) | 16 | 0.04% |
| Dennis Serrette (Alliance) | 8 | 0.02% |
| Scattered Write-In | 115 |
|
| Michael Dukakis (Dem) | 28,759 | 64.41% |
| George H.W. Bush (Rep) | 15,453 | 34.61% |
| Ron Paul (Libertarian) | 149 | 0.33% |
| Willa Kenoyer (Socialist) | 34 | 0.08% |
| Lenora Fulani (New Alliance) | 33 | 0.07% |
| Lyndon LaRouche (Natl. Econ. Recovery) | 22 | 0.05% |
| David Duke (Populist) | 22 | 0.05% |
| James Warren (Soc Work) | 15 | 0.03% |
| Ed Winn (Workers League) | 6 | 0.01% |
| Scattered write-in | 154 |
| Bill Clinton (Dem) | 28,656 | 55.35% |
| George H.W. Bush (Rep) | 14,041 | 27.12% |
| Ross Perot (Nom. by Pet.) | 8,625 | 16.66% |
| Andre Marrou (Libertarian) | 100 | 0.19% |
| John Hagelin (Natural Law) | 69 | 0.13% |
| Delbert Ehlers (Nom. by Pet.) | 48 | 0.09% |
| James Warren (Soc Workers) | 31 | 0.06% |
| Ron Daniels (New Tomorrow) | 31 | 0.06% |
| Lenora Fulani (New Alliance) | 30 | 0.06% |
| Jack Herer (Grassroots) | 26 | 0.05% |
| Bo Gritz (Populist) | 23 | 0.04% |
| Howard Phillips (Taxpayers) | 10 | 0.02% |
| John Yiamouyiannis (Nom. Pet.) | 5 | 0.01% |
| Lyndon Larouche (Ind. for Economic Recovery) | 5 | 0.01% |
| Scattered write-in | 74 |
| Bill Clinton (Dem) | 27,888 | 60.98% |
| Bob Dole (Rep) | 13,402 | 29.31% |
| Ross Perot (Reform) | 2,313 | 5.06% |
| Ralph Nader (Green) | 1,491 | 3.26% |
| Harry Browne (Libertarian) | 283 | 0.62% |
| John Hagelin (Natural Law) | 199 | 0.44% |
| Howard Phillips (Taxpayers) | 37 | 0.08% |
| James Harris (Soc Workers) | 35 | 0.08% |
| Write-Ins | 84 | 0.29% |
| Al Gore (Dem) | 31,174 | 59.08% |
| George W. Bush (Rep) | 17,899 | 33.92% |
| Ralph Nader (IA Green) | 3,248 | 6.16% |
| Harry Browne (Libertarian) | 205 | 0.39% |
| Pat Buchanan (Reform) | 103 | 0.20% |
| John Hagelin (Nom. Pet.) | 50 | 0.09% |
| Howard Phillips (Constitution) | 14 | 0.03% |
| David McReynolds (Socialist) | 10 | 0.02% |
| James Harris (Soc. Work.) | 5 | 0.01% |
| write in | 61 |
| John Kerry (Dem) | 41,939 | 64.04% |
| George W. Bush (Rep) | 22,740 | 34.72% |
| Ralph Nader (Nom. Pet.) | 310 | 0.47% |
| Michael Badnarik (Libertarian) | 220 | 0.34% |
| David Cobb (Green) | 96 | 0.15% |
| James Harris (Soc. Work.) | 91 | 0.14% |
| Michael Peroutka (Constitution) | 32 | 0.05% |
| Gary Van Auken (Nom. Pet.) | 4 | 0.01% |
| Write-Ins | 60 |
| Barack Obama (Dem) | 51,027 | 69.91% |
| John McCain (Rep) | 20,732 | 28.40% |
| Ralph Nader (Peace & Freedom) | 326 | 0.45% |
| Bob Barr (Libertarian) | 287 | 0.39% |
| Chuck Baldwin (Constitution) | 128 | 0.18% |
| Cynthia McKinney (Green) | 120 | 0.16% |
| Brian Moore (Socialist) | 10 | 0.01% |
| James Harris (Soc. Work.) | 9 | 0.01% |
| Gloria LaRiva (Socialism & Liberation) | 4 | 0.00% |
| Write-Ins | 346 |
| Barack Obama (Dem) | 50,666 | 66.69% |
| Mitt Romney (Rep) | 23,698 | 31.19% |
| Gary Johnson (Libertarian) | 846 | 1.11% |
| Jill Stein (Green) | 333 | 0.44% |
| Virgil Goode (Constitution) | 67 | 0.09% |
| Jerry Litzel (Nom. Pet.) | 26 | 0.03% |
| James Harris (Soc. Work.) | 11 | 0.01% |
| Gloria LaRiva (Socialism & Liberation) | 10 | 0.01% |
| Write-Ins | 320 | 0.42% |
| Hillary Clinton (Democratic) | 50,200 | 65.25% |
| Donald J. Trump (Republican) | 21,044 | 27.35% |
| Gary Johnson (Libertarian) | 2,758 | 3.58% |
| Jill Stein (Iowa Green) | 878 | 1.14% |
| Evan McMullin (Nom. Pet.) | 721 | 0.94% |
| Darrell L. Castle (Constitution) | 130 | 0.17% |
| Dan R. Vacek (Legal Marijuana Now) | 125 | 0.16% |
| Lynn Kahn (New Independent Party Iowa) | 67 | 0.09% |
| Gloria La Riva (Socialism & Liberation) | 35 | 0.05% |
| Rocky Roque De La Fuente (Nom. Pet.) | 18 | 0.02% |
| Write-in | 964 |
1.27% |
| Joseph R. Biden (Democratic) | 59,177 | 70.57% |
| Donald J. Trump (Republican) | 22,925 | 27.34% |
| Jo Jorgensen (Libertarian) | 964 | 1.15% |
| Howie Hawkins (Green) | 213 | 0.25% |
| Kanye West | 170 | 0.20% |
| Don Blankenship (Constitition) | 62 | 0.07% |
| Roque Rocky De La Fuente (Alliance) | 22 | 0.03% |
| Ricki Sue King (Genealogy Know Your Family History) | 19 | 0.02% |
| Brock Pierce | 18 | 0.02% |
| Write-In | 281 | 0.34% |
| Kamala Harris (Democratic) | 58,846 | 67.92% |
| Donald J. Trump (Republican) | 26,087 | 30.11% |
| Robert F. Kennedy Jr. (We The People) | 484 | 0.56% |
| Chase Oliver (Libertarian) | 402 | 0.46% |
| Claudia De la Cruz (Socialism & Liberation) | 218 | 0.25% |
| William P. Stodden (Socialist) | 17 | 0.02% |
| Shiva Ayyadurai | 14 | 0.02% |
| Write-In | 576 | 0.66% |
Prior to 1920, Iowa voters (men only, before the 19th Amendment gave women the right to vote) cast votes for each individual presidential elector separately, rather than voting for a presidential candidate. Because some voters skipped some electors or split their tickets, vote totals for presidential elector candidates varied slightly.
For example, in 1916 Iowa voters cast ballots for two electors at large and for eleven separate congressional district electors. All voters in the state were able to vote for all 13 electors. In Johnson County, vote totals for the Democratic candidates for elector supporting Woodrow Wilson ranged from 3,623 to 3,650, and totals for Republican candidates for elector supporting Charles Evans Hughes were between 2,673 and 2,702.